Even in times of a growing market of specialized NoSQL databases, the relevance of traditional RDBMS doesn't decline. Especially when it comes to the calculation of aggregates based on complex data sets that can not be processed as a batch like Map&Reduce. MySQL is already bringing in a handful of aggregate functions that can be useful for a statistical analysis. The best known of this type are certainly:
COUNT(x), SUM(x), AVG(x), MIN(x), MAX(x), STD(x)
In addition, there are a number of statistical evaluations which are also worthwhile - if not even more interesting and meaningful, but with MySQL only producible with greater efforts. What about the different averages? The harmonic average, a weighted average or the geomean? What is in the course of this with the aggregate product? How do we determine the mode, the median? The covariance?
In the following article I want to go to the bottom of these questions and develop a list of standard formulas for a statistical evaluation. Presumably the article is meant more for beginners. In addition, a few new features have been poured into my infusion UDF, which simplifies some of the calculations. You can check out the source of the UDF on Github:
Calculating averages with MySQL
There are a few different averages with different fields of application. The most important ones are:
Arithmetic mean
The classical arithmetic mean is already calculable natively as indicated above with the AVG() function or by doing it yourself:
SELECT SUM( x ) / COUNT( x ) FROM t1
Weighted average
A weighted average can be obtained in a similar way by dividing out two sums as follows, where "w" is the per-row weight:
SELECT SUM( x * w ) / SUM( w ) FROM t1
Harmonic average
The harmonic average, which for example is used for rates and ratios can also be calculated quite easily with native functions. Suppose you want to calculate the average cost of data transmission. One hosting packet allows you to run at a rate of 9GiB per dollar and one on 17GiB per dollar. An arithmetic mean would give you an average of 13GiB / dollar, which is wrong. The correct solution would be 2 /(1 / 9 + 1 / 17) = 11.7GiB / dollar, or in abstract MySQL syntax:
SELECT COUNT( x ) / SUM( 1 / x ) FROM t1
Geometric mean
The geometric average, which usually comes into use when it comes to the calculation of product averages, such as tiered discounts or similar quantities, can also be calculated when we introduce some kind of algebra. The product of several numbers can also be defined by the sum of their logarithms, which in turn is taken as the exponent of e. In MySQL syntax that would mean:
SELECT EXP( SUM( LOG( x ) ) ) FROM t1
With this knowledge in mind, we can easily extrapolate from the product to the geomean:
SELECT POW( EXP( SUM( LOG( x ) ) ), 1 / COUNT( x ) ) FROM t1
Which can finally be simplified to:
SELECT EXP( SUM( LOG( x ) ) / COUNT( x ) ) FROM t1
This could be even further simplified to the following, but should be treated with caution since it might be numerically more unstable:
SELECT EXP( AVG( LOG( x ) ) ) FROM t1
Midrange
The mid-range only takes into account the extremes of a data set and can be computed as follows:
SELECT( MAX( x ) + MIN( x ) ) / 2 FROM t1
Median
There are some good examples in the comments of the documentation of how the median can be implemented with MySQL. However, a spoiled Excel user will run in circles screaming in the face of such cruelties. That's why I've added a median function to my UDF, so that this will be valid:
SELECT median( x ) FROM t1
Most popular value - Mode
For the sake of completeness, I'd like to add the mode, even if this can be determined with the help of native SQL and without too much math:
SELECT x, COUNT( * )
FROM t1
GROUP BY x
ORDER BY COUNT( * ) DESC
LIMIT 1;
Calculating deviations with MySQL
MySQL already provides some functions to identify and classify deviations in data series. In itself, all existing functions are based on the same statistical moment, thus the following relations between the functions can be found:
STDDEV_POP( x ) = STD( x ) = STDDEV( x )

VAR_POP( x ) = VARIANCE( x )

VAR_POP( x ) = STDDEV_POP( x ) * STDDEV_POP( x )

VAR_POP( x ) = VAR_SAMP( x ) *( COUNT( x ) - 1 ) / COUNT( x )

VAR_POP( x ) = SUM( x * x ) / COUNT( x ) - AVG( x ) * AVG( x )

VAR_SAMP( x ) = STDDEV_SAMP( x ) * STDDEV_SAMP( x )

VAR_SAMP( x ) = VAR_POP( x ) /( COUNT( x ) - 1 ) * COUNT( x )
Covariance
Oracle provides the additional functions COVAR_POP(x, y) and COVAR_SAMP(x, y), respectively, in order to calculate the co-variance - the variance between two random variables. With MySQL, this functionality can be simulated with native functions as follows:
COVAR_POP(x, y):
SELECT( SUM( x * y ) - SUM( x ) * SUM( y ) / COUNT( x ) ) / COUNT( x ) FROM t1

COVAR_SAMP(x, y):
SELECT( SUM( x * y ) - SUM( x ) * SUM( y ) / COUNT( x ) ) /( COUNT( x ) - 1 ) FROM t1
This task would be more flawless and efficient with a native function COVARIANCE(x, y), which I've added to my infusion extenseion in order to have a shortcut for the COVAR_POP() example above:
SELECT COVARIANCE( x, y ) FROM t1
Pearson Correlation Coefficient
The covariance function can now be used to calculate the Pearson correlation coefficient:
SELECT COVARIANCE( x, y ) / ( STDDEV( x ) * STDDEV( y ) ) FROM t1
Higher statistical moments
At this point I'd like to mention two other new functions I've intrododuced with my infusion UDF; higher statistical moments, namely the skewness and the kurtosis of a data series:
SELECT SKEWNESS( x ) FROM t1
as well as
SELECT KURTOSIS( x ) FROM t1
Row Ranking
If you want to give each line of a MySQL result a unique serial number, you must use a little trick with variables like this:
SELECT @x:= @x + 1 AS rank, title
FROM t1
JOIN (
   SELECT @x:= 0
)X
ORDER BY weight;
This example may be easy, but it complicates things with more complex queries. I don't know why MySQL doesn't have a function for this, but I've caught it with my infusion extension to correspond to TSQL:
SELECT row_number() AS rank, title FROM t1 ORDER BY weight;
Longtail Analysis
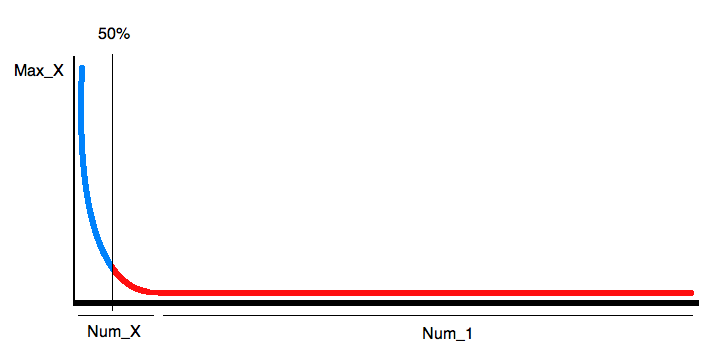
I think it's better to start with an example to illustrate further considerations. With Longtail analysis I mean the representation of a frequency distribution - or a histogram. For search engine optimization you can determine what the search term distribution over a certain period of time was. Since the proportion of unique search terms is usually relatively high and since the image of such a graph is almost always the same, it's obvious to not run GROUP BY queries on a large data set to simply get something like the following:

Looking at the graph, on needs only a few information to approximate it: The number of search queries, the number of unique queries, the number of most searches and the position of the 50% gap. Then you can recreate the image by a cubic function quite well. The only value that we can not calculate with standard tools of MySQL is the 50% limit. To still be able to calculate that, Ive added three new features to the functionality of MySQL: LESSPART(x, part), LESSPARTPCT(x, part%), LESSAVG(x). Let's formulate the query to get the 4 information to draw the graph:
SELECT MAX( x ) Max_X,
   COUNT( x = 1 OR NULL ) Num_1,
   COUNT( x > 1 OR NULL ) Num_X,
   LESSPARTPCT( x, 0.5 ) Border
FROM (
   SELECT COUNT( * ) x
   FROM phrase
   GROUP BY P_ID
) tmp;
Of course, the function LESSPARTPCT can be simulated with native SQL, which is much more complicated with a dynamic result as shown above:
SELECT COUNT( c ) AS LESSPARTPCT
FROM(
   SELECT x, @x:= @x + x, IF(@x < @sum * 0.5, 1, NULL) AS c
   FROM t1
   JOIN(
      SELECT @x:= 0, @count:= 0, @sum:= SUM(x)
      FROM t1
   )x
   ORDER BY x
)x
Incidentally, the term @x:= @x + x, to get a running sum, can also be simplified with the newly added UDF function RSUMi().
A simple ranking system
As a final example I'd like to introduce the function LESSAVG to build a simple ranking system. The goal is to tell how many may be better or worse than average. As such, we need only 2 Information: How many elements are there in total and how many are smaller than average. This little query is enough to do this:
SELECT count( * ) count, lessavg( x ) less FROM t1;
Based on that you could even customize the output:
if (less / count > 0.5) {

    print less / count * 100, "% are worse than average"

} else {

    print (count - less) / count * 100, "% are better than average"
}
Understanding MySQL Internals
If you want to contribute or simply want to understand the UDF, I highly recommend the book "Understanding MySQL Internals" of Sasha Pachev from the Percona team:
